Quote:
Originally Posted by grean

Does anyone know, if the YellowStone Caldera does go, will the blast kill those of us in Dallas immediately, ....
|
No, the blast won't. But .... it won't matter ....
BTW: There are loudmouthed SocialistLiberalAntiTrumperPun dits who don't know shit from Shinola about geography, geology, and the structure of the Earth's crust, because they never thought about "stuff" like that, but spent their time playing hop-scotch in the younger years and guzzle-scotch in the later years.
The Northern circle around the Pacific Ocean from just above Australia almost all the way down the coast of South America is not called the "Ring of Fire" because Trump named it as such.
Seismic and volcanic activity is a way of life if one lives around the "Ring of Fire" ... which includes geologically the area of Mt. St. Helen and the Yellow Stone volcano.
Keep in mind that the same loudmouthed SocialistLiberalAntiTrumperPun dits, who don't know shit from Shinola about geography, geology, and the structure of the Earth's crust, are the same group of idiots who are running around hysterically screaming about "global warming" (aka now called ignorantly "client control"!!!!!!) like their hair is on fire and we'll all die within a year .... Cortez has been more hysterical about that the Schumer has over Muslim Terrorists being kept from entering the U.S. borders.
So, just dismiss them as a bunch of immature brats.
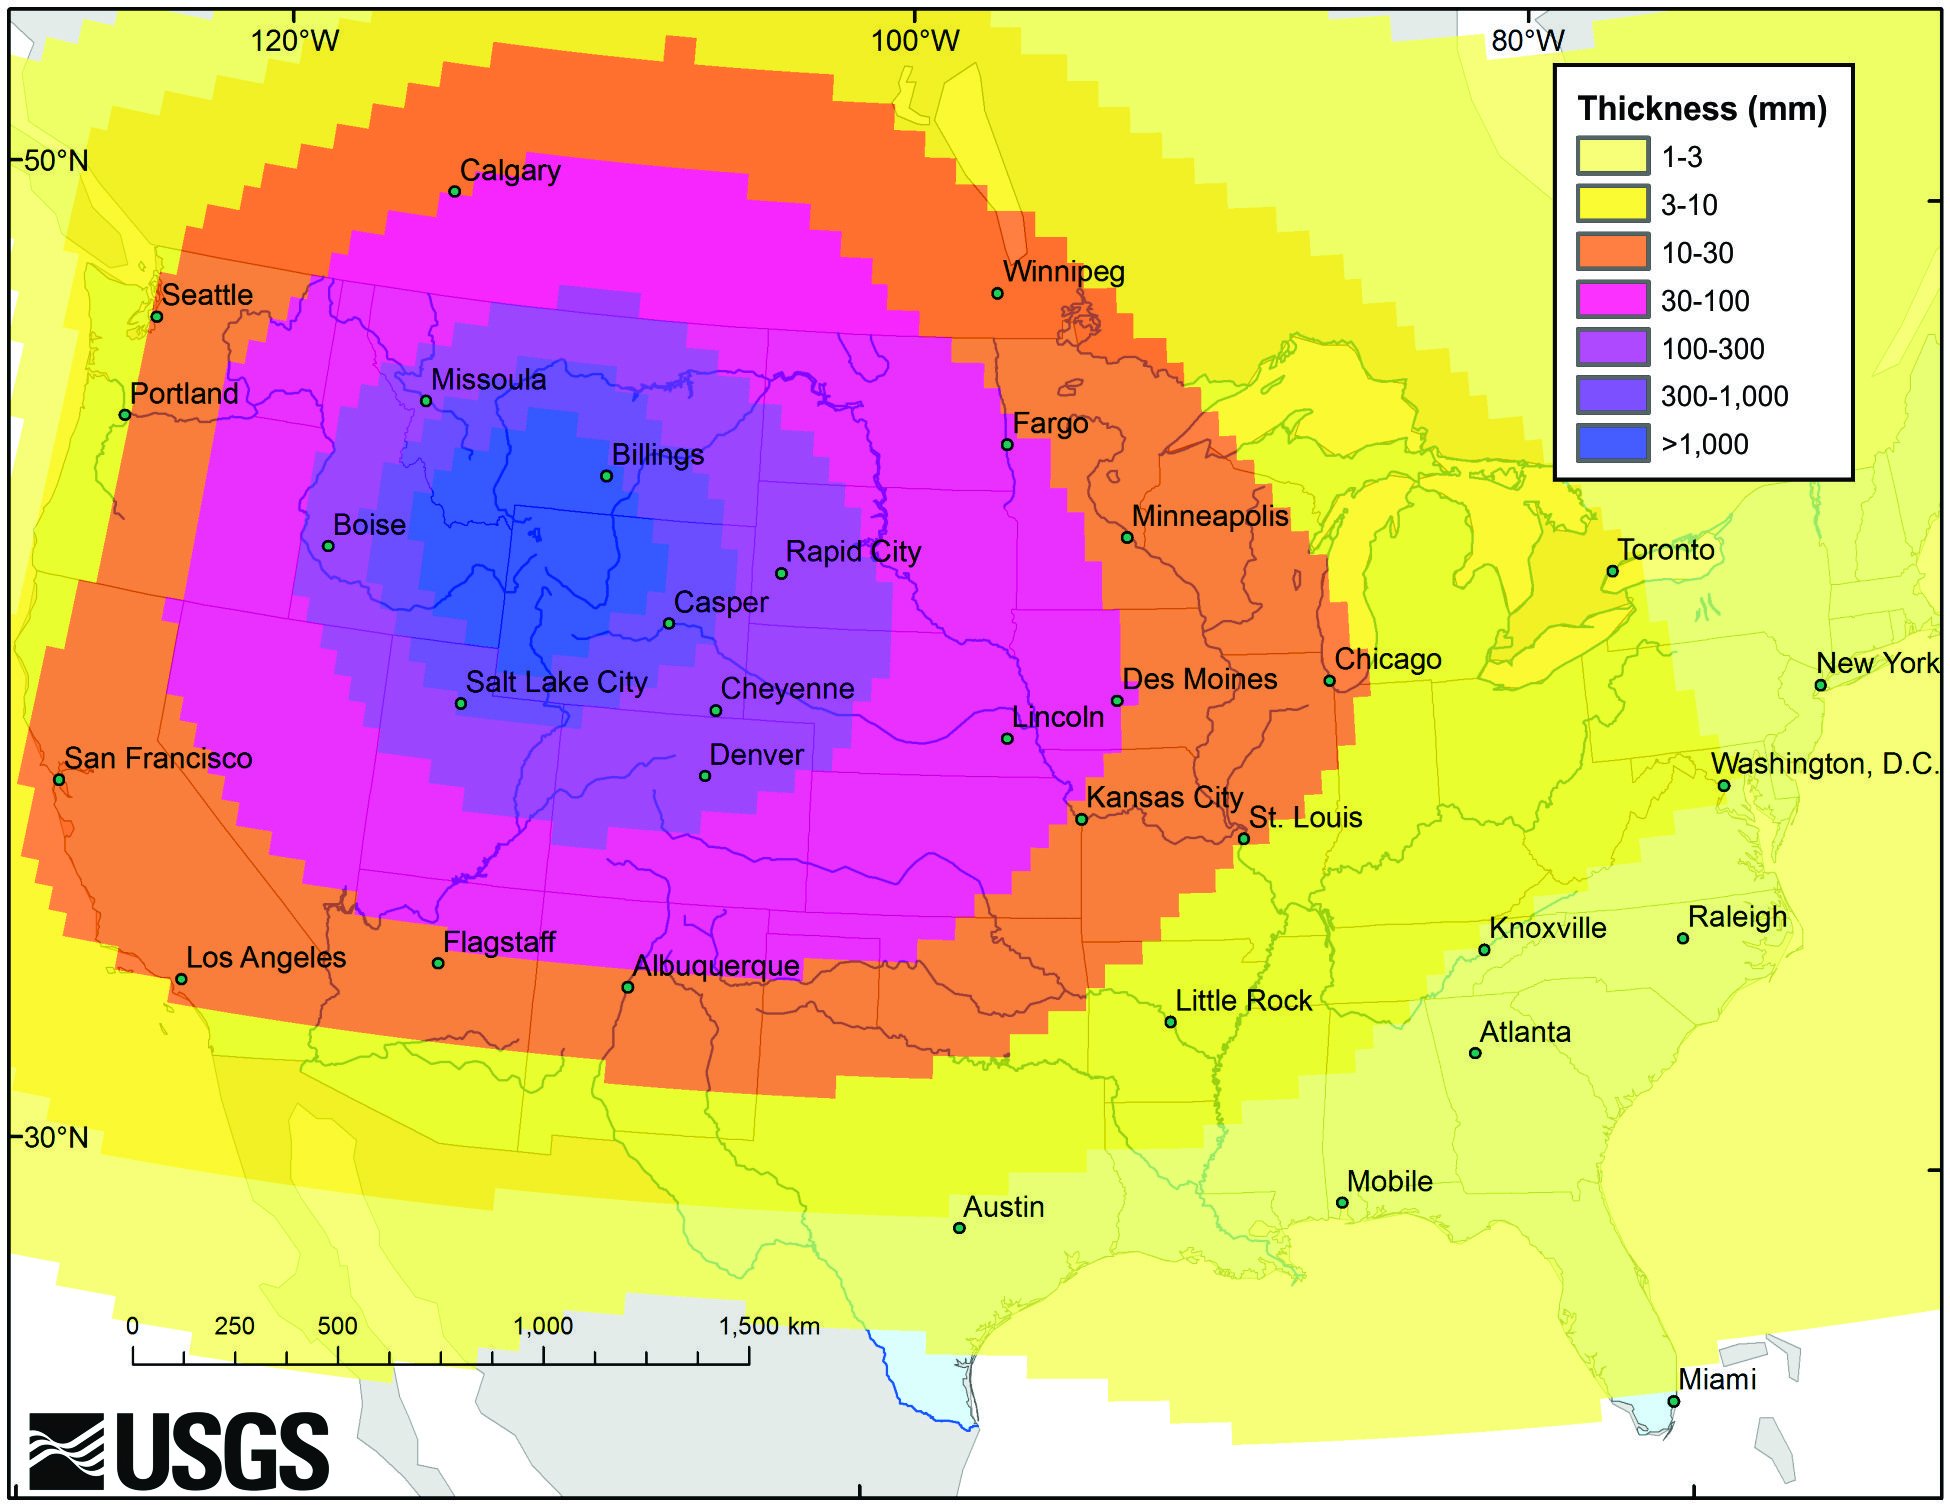
Oh ... "USGS" stands for United States Geological Survey ... a Federal government agency!
Now why would a loudmouthed SocialistLiberalAntiTrumperPun dits dispute a Government agency?
Unless of course it was the Immigration Service aka ICE!
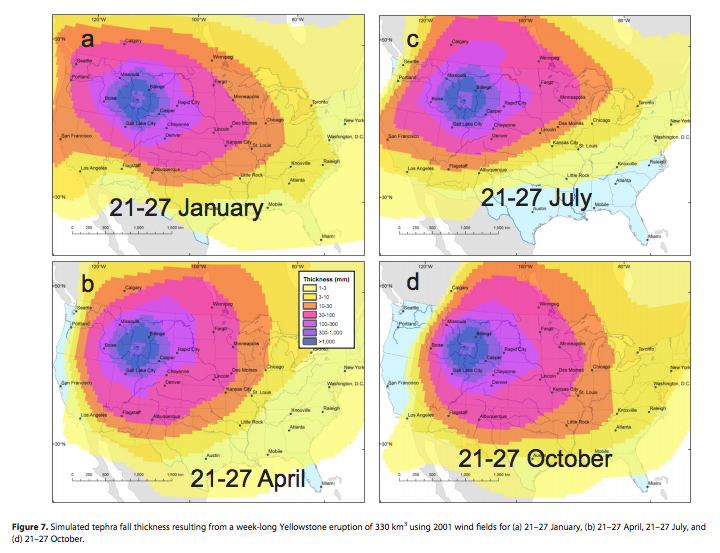
BTW: Notice California .... ash levels ...10-30 feet! FYI: Based upon my education/understanding of catastrophic blasts the pattern portrayed in the above illustration is a "neutral wind" diagram and the seasonal prevailing winds would adjust that diagram into an oblong configuration so that the ash deposits would be deeper in some areas than portrayed ... depending on the wind vector.
Here is an illustration of the seasonal differences: