Quote:
Originally Posted by dilbert firestorm

i don't know. that is what they're claiming after the fact.
of course, considering the cause of death can be manipulated...
|
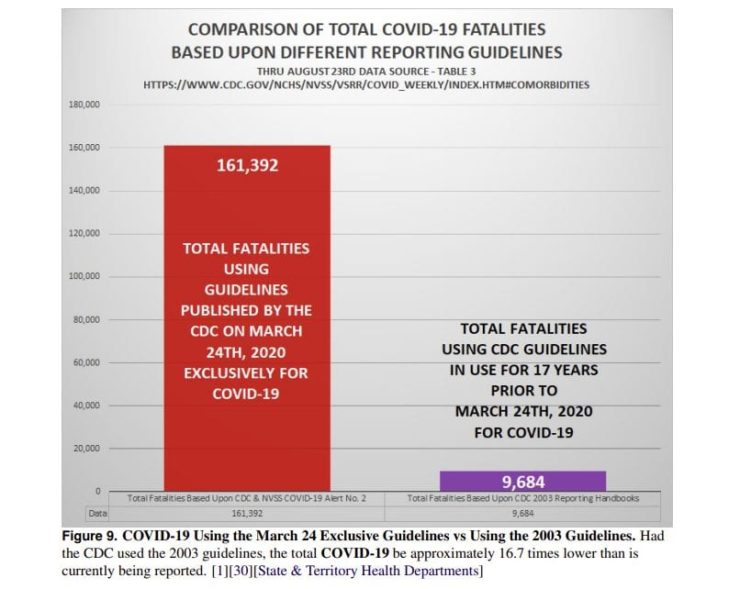
There are many, many posts about the CDC violating their own guidance in these here fora. They often center on the concept or 'from' versus 'with' the covid. Of course, they had to set the table via one Neil Furguson with his garbage modeling program which predicted 2.2M deaths and told Fauci, who then told Trump and ultimately we are here. Most forget or do not know, the same Neil Furguson was responsible for similar garbage modeling of Mad Cow disease.
That's how you use fear porn to metastasize the mass formation. This was on the heals of the propaganda that China displayed early on of people dropping dead in the streets, which turned out to be intentionally fake news. They knew full well that people have a time memory continuum deficiency. Most forgot that those were all fakes or did not know, but it still registers in their memory as being super-bad mojo and deadly. BTW and for good measure - most of those dropping dead pictures and videos are scrubbed (memory-holed) from the internets already. We use to refer to that as a 'cover up' operation.
Anyway, both charts are the covid related. The first is specific to this post from a point in time. The second is something we use to rely on in science, known as observed data. Now we pretty much run on 'feelings' instead.


